Sample Size Re-estimation (SSR)
Planning and design
Introduction to sample size calculation
When deriving an initial sample size at the design stage, researchers decide on acceptable false positive and false negative error rates. These rates are the risks they are willing to accept for making incorrect decisions about the benefit of new treatments. Additional information on design parameters required for calculating a sample size includes:
- targeted treatment effect measure of interest,
- nuisance parameters.
The targeted treatment effect (e.g., minimum clinically important difference) is decided upfront as informed via several approaches 1, 2. However, there are also circumstances when marked uncertainty around the targeted treatment effect exists, and this may need to be incorporated 3.
Nuisance design parameters are not of direct or immediate interest to researchers but play a role in inference (estimating the treatment effect and/or its precision). These may include those relating to outcome variability (e.g., standard deviation for a continuous outcome, control event rate for a binary outcome, or control hazard rate for a time-to-event outcome); the correlation of outcome measures between baseline and follow-up; dropout/data completion rate; and intra-cluster correlation coefficient in clustered trial outcome data.
References
1. Cook et al. DELTA2 guidance on choosing the target difference and undertaking and reporting the sample size calculation for a randomised controlled trial. BMJ. 2018;363:k3750.
2. Cook et al. Specifying the target difference in the primary outcome for a randomised controlled trial: guidance for researchers. Trials. 2015;16(1):12.
3. Hsiao et al. Optimal promising zone designs. Biometrical J. 2018; 61(5): 1175-1186.
3. Hsiao et al. Optimal promising zone designs. Biometrical J. 2018; 61(5): 1175-1186.
Types of SSR adaptive designs and study design parameters
SSR can be grouped into comparative and non-comparative approaches 1 depending on whether the primary outcome(s) is/are compared between treatment arms when the sample size is re-estimated (see Figure 2). The approach is further categorised as blinded or unblinded depending on the nature of interim data used to re-estimate design parameters and sample size (see methods for re-estimating design parameters).
Figure 2.
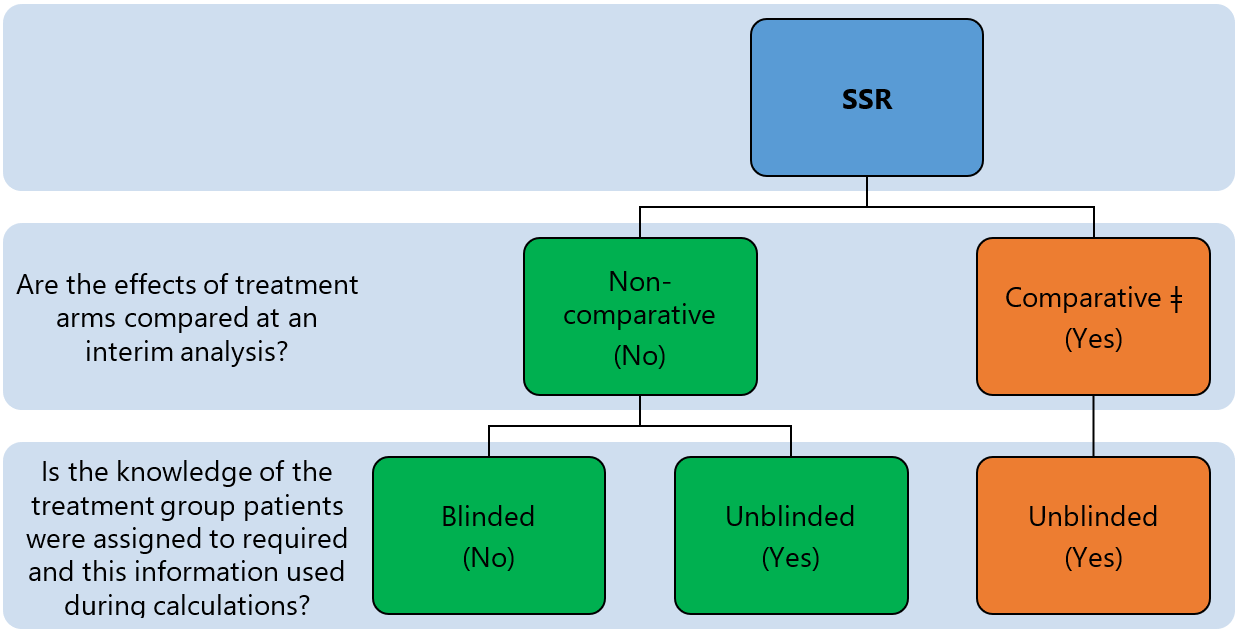
Classification of SSR methods. ǂ not addressed in this section.
References
1. Wang et al. Evaluation of the extent of adaptation to sample size in clinical trials for cardiovascular and CNS diseases. Contemp Clin Trials. 2018;67:31–6.
Appropriateness
SSR is necessary when there are considerable uncertainties around design parameters used to inform the initial sample size calculation. For example, when prior data from a similar trial patient group for a specific primary outcome is limited or unavailable, when assumptions are based solely on the opinions of clinicians or researchers, or when it is believed that the standard of care has significantly changed since previous studies were completed, preventing researchers from obtaining reliable estimates from historical data. SSR may also be used to provide reassurance or to validate design assumptions regardless of the existing level of uncertainty.
The downside of non-comparative SSR approaches (blinded or unblinded) estimates of nuisance design parameters is that they can result in an increase in the sample size, but for a new treatment which may turn out to be ineffective at the end of the study. This may be viewed as wasteful and raises an ethical dilemma. Research teams need to consider ethical and practical issues, and alternative scenarios that could arise when conducting SSR. The opinions of public advisors may be valuable to balance patients and scientific interests.
Design concepts
Like in fixed trial designs, researchers start by making assumptions on design parameters using relevant information available to them while acknowledging existing uncertainties and estimate the initial sample size needed to address research questions. Furthermore, researchers (Figure 3):
Figure 3.
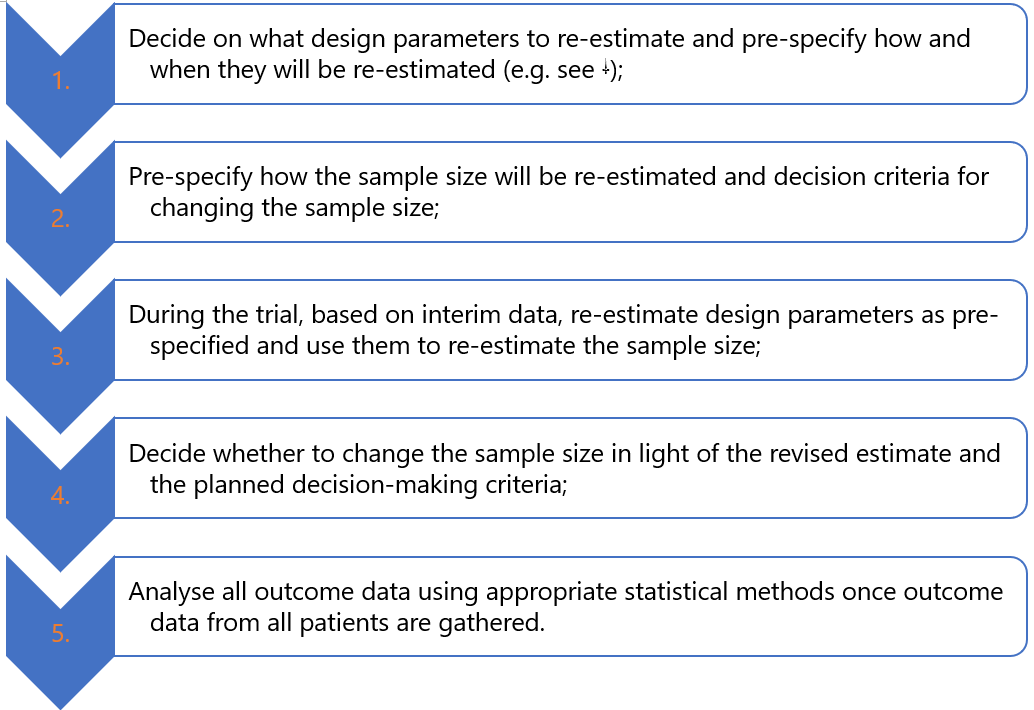
SSR concepts.
SSR can be considered together with other trial adaptations. For example, researchers may want to only consider increasing the sample size for a promising treatment or stop the trial early if there is sufficient evidence that the new treatment is unlikely to be beneficial (futility, e.g., 1, 2, 3, 4, 5, 6, 7). The trial goals researchers want to achieve dictate the nature of adaptations to consider (see general considerations discussion).
References
1. Chen et al. Sample size adjustment based on promising interim results and its application in confirmatory clinical trials. Clin Trials. 2015;12(6):584-95.
2. Chen et al. Increasing the sample size when the unblinded interim result is promising. Stat Med. 2004;23(7):1023-38.
3. Hsiao et al. Optimal promising zone designs. Biometrical J. 2018;61(5):1175-1186.
4. Mehta et al. Adaptive increase in sample size when interim results are promising: a practical guide with examples. Stat Med. 2011;30(28):3267–84.
5. Edwards et al. A systematic review of the “promising zone” design. Trials. 2020;21(1):1000.
6. Jennison et al. Adaptive sample size modification in clinical trials: start small then ask for more? Stat Med. 2015;34(29):3793-810.
7. Pritchett et al. Sample size re-estimation designs in confirmatory clinical trials—current state, statistical considerations, and practical guidance. Stat Biopharm Res. 2015;7(4):309–21.
Underpinning statistical methods
SSR methods are based on the concept of internal pilot trials 1. At the design stage, researchers use available data to inform the calculation of the initial sample size using relevant methods (e.g., analytical formulae or simulation). They then recruit a fraction (group of participants) of this initial sample size, often known as an internal pilot phase, where an interim analysis can be performed. Ideally, the interim analysis sample sizes should be reasonably large to provide precise estimates of nuisance parameters to yield reliable revised sample sizes (see “when to conduct SSR and how often”). Once outcome data from these interim patients are gathered, nuisance parameters assumed at the design stage are re-estimated using specific approaches (see “methods for re-estimating design parameters”). Finally, these estimates are then used to re-calculate the sample size using the same methods (e.g. analytical formulae) used at the design stage 2, 3.
Methods for re-estimating design parameters
Ideally, researchers should obtain reliable interim estimates of design parameters and avoid introducing potential biases by revealing (or unblinding) the treatments participants were allocated to and/or the emerging treatment effect to those conducting the trial. The severity of this problem and implications vary from trial to trial. Blinded estimates of design parameters can be calculated from aggregated (pooled) interim data without separating patients by their allocated treatment. The most common are well-established blinded estimators focusing on blinded variance estimators for continuous outcomes (e.g., one-sample or pooled variance or adjusted one-sample variance) and the control event rate for a binary outcome (e.g. using overall event rate as a proxy) 4, 5, 6, 7, 8, 9. SSR methods involving blinded estimators have been extended to cover multi-arm trials 10 and baseline adjusted analysis 24 with continuous outcomes, trials with count outcomes with and without overdispersion 11, 12, 25, and time-to-event outcomes 13, 14, 15. Extensions to these approaches also cover non-inferiority and equivalence trials 16, stepped-wedge cluster randomised trials 17, crossover trials 18, and longitudinal trials 19. Some methods use Bayesian methods to incorporate uncertainty around nuisance parameters during SSR 20, 21, 22.
Unblinded estimators use the treatment group assignment for their estimation. For example, the control event rate is estimated by the response rate of patients in the control group only. Similarly, the between-group variance can be directly estimated. Unblinded variance estimators for specific outcomes (e.g., count data 12) and study designs with continuous and binary outcomes (e.g., stepped-wedge cluster randomised 17, crossover 18 , and diagnostic accuracy 23 trials) have also been developed.
Table 1 summarises the pros and cons of blinded and unblinded estimators of design parameters.
Table 1.
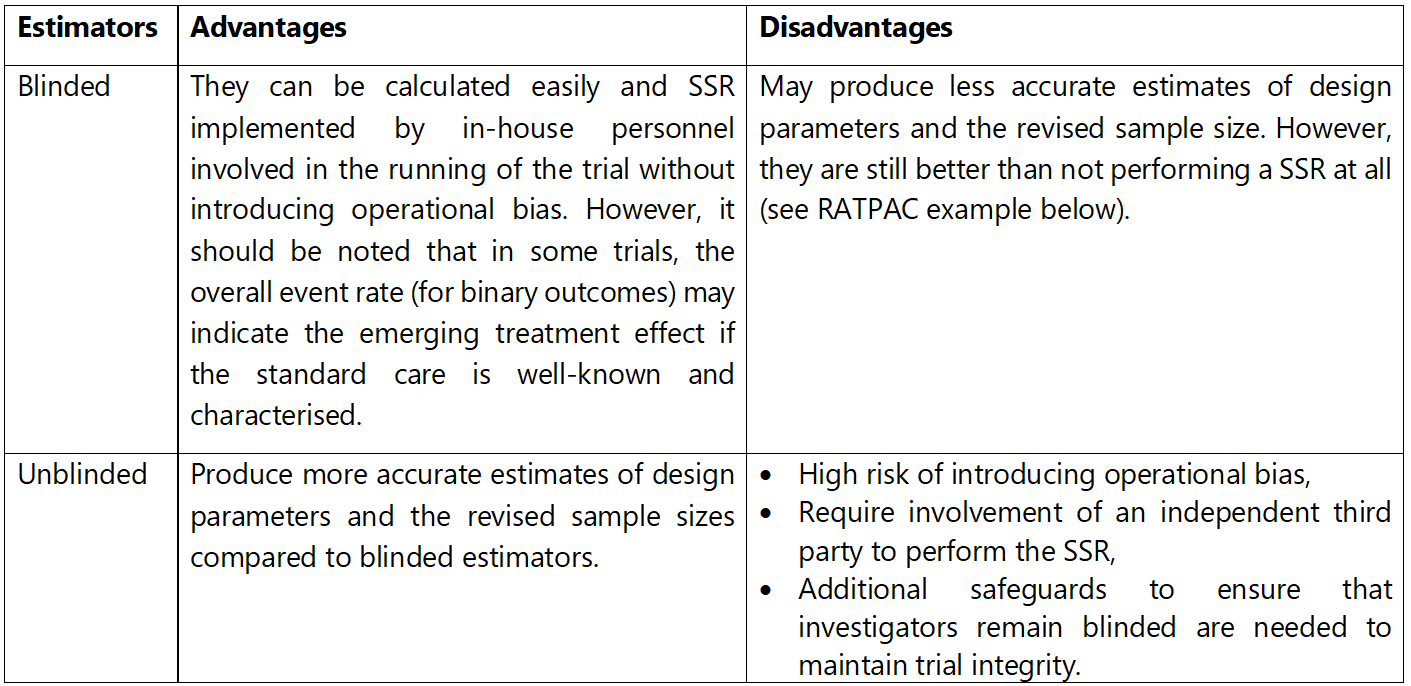
Advantages and disadvantages of blinded and unblinded estimators of design parameters.
References
1. Wittes et al. The role of internal pilot studies in increasing the efficiency of clinical trials. Stat Med. 1990;9(1–2):65–71.
2. Julious. Tutorial in biostatistics: Sample sizes for clinical trials with Normal data. Stat Med; 2004;23:1921–86.
3. Julious et al. Tutorial in biostatistics: Sample sizes for parallel group clinical trials with binary data. Stat Med. 2012;31(24):2904–36.
4. Friede et al. Sample size recalculation in Internal pilot study designs: A review. Biometrical J. 2006;48(4):537–55.
5. Kieser et al. Simple procedures for blinded sample size adjustment that do not affect the type I error rate. Stat Med. 2003;22(23):3571–81.
6. Proschan. Two-stage sample size re-estimation based on a nuisance parameter: a review. J Biopharm Stat. 2005;15(4):559–74.
7. Gould et al. Sample size re-estimation without unblinding for normally distributed outcomes with unknown variance. Commun Stat - Theory Methods. 1992;21(10):2833–53.
8. Gould. Planning and revising the sample size for a trial. Stat Med. 1995;14(9–10):1039–51.
9. Zucker et al. Internal pilot studies II: comparison of various procedures. Stat Med. 1999;18(24):3493–509.
10. Kieser et al. Blinded sample size reestimation in multiarmed clinical trials. Drug Inf J. 2000;34(2):455–60.
11. Friede et al. Blinded sample size reestimation with count data: Methods and applications in multiple sclerosis. Stat Med. 2010;29(10):1145–56.
12. Schneider et al. Blinded and unblinded internal pilot study designs for clinical trials with count data. Biometrical J. 2013;55(4):617–33.
13. Friede et al. Blinded sample size reestimation in event-driven clinical trials: Methods and an application in multiple sclerosis. Pharm Stat. 2019.
14. Todd et al. A practical comparison of blinded methods for sample size reviews in survival data clinical trials. Pharm Stat. 2012;11(2):141–8.
15. Hade et al. Follow up after sample size re-estimation in a breast cancer randomized trial for disease-free survival. Trials. 2019;20(1).
16. Friede et al. Blinded sample size reassessment in non-inferiority and equivalence trials. Stat Med. 2003;22(6):995–1007.
17. Grayling et al. Blinded and unblinded sample size reestimation procedures for stepped-wedge cluster randomized trials. Biometrical J. 2018;60(5):903–16.
18. Grayling et al. Blinded and unblinded sample size reestimation in crossover trials balanced for period. Biometrical J. 2018;60(5):917–33.
19. Wachtlin et al. Blinded sample size recalculation in longitudinal clinical trials using Generalized Estimating Equations. Ther Innov Regul Sci. 2013;47(4):460–7.
20. Mütze et al. Sample size re-estimation incorporating prior information on a nuisance parameter. Pharm Stat. 2018;17(2):126–43.
21. Brakenhoff et al. Bayesian sample size re-estimation using power priors. Stat Methods Med Res. 2019;28(6):1664–75.
22. Hartley. Adaptive blinded sample size adjustment for comparing two normal means-a mostly Bayesian approach. Pharm Stat. 2012;11(3):230–40.
23. McCray et al. Sample size re-estimation in paired comparative diagnostic accuracy studies with a binary response. BMC Med Res Methodol. 2017;17(1):102.
24. Friede et al. Blinded sample size recalculation for clinical trials with normal data and baseline adjusted analysis. Pharm Stat. 2011;10(1):8–13.
25. Asendorf. Blinded sample size re-estimation for longitudinal overdispersed count data in randomized clinical trials with an application in multiple sclerosis. Thesis. 2020.
How are decisions made?
There are restricted and unrestricted approaches to making SSR decisions. The restricted approach only allows the original sample size to increase or stay the same, even if the SSR indicates that a reduction in the original sample size should be made 1 (see important considerations for discussion). In contrast, the unrestricted approach is more flexible as it permits either an increase or decrease, or no change to the original sample size 2. Here, the sample size at an interim analysis is the natural lower threshold for the revised sample size. In both approaches, researchers usually cap the maximum sample size increase that is acceptable to them based on feasibility and financial constraints.
Given the revised sample size, a decision is then made depending on the adaptation rules pre-specified by the researchers at the planning stage. For example, an unrestricted SSR may include non-overlapping adaptation rules like:
- proceed as planned to recruit the original sample size because the assumed design parameters and observed estimates are similar (e.g., if revised power is within a preset tolerable threshold in either direction);
- increase the original sample size to recruit the revised sample size as long as it is below the pre-specified cap set for feasibility and financial constraints (e.g., if revised power falls below a preset tolerable value and the revised sample size is greater than the original);
- increase the original sample size to reach the pre-specified cap (if the revised sample size is above the cap);
- recruit to the reduced revised sample size (e.g., if the revised power is above the planned by at least a preset threshold).
PANDA users should note that trial circumstances differ and so do the SSR adaptation rules that can be considered by researchers.
References
1. Wittes et al. The role of internal pilot studies in increasing the efficiency of clinical trials. Stat Med. 1990;9(1–2):65–71.
2. Birkett et al. Internal pilot studies for estimating sample size. Stat Med. 1994;13(23–24):2455–63.
2. Birkett et al. Internal pilot studies for estimating sample size. Stat Med. 1994;13(23–24):2455–63.
When to conduct SSR and how often?
The goal is to obtain reliable interim estimates such that once the sample size is revised it is stable and does not become a moving target. Thus, the interim sample size should be ‘reasonably large’ relative to the original sample size to robustly inform the SSR. If SSR is done too early, with insufficient interim data, the estimates will be unreliable and methods that can adjust these estimates for their small sample size result in excessively large (or inappropriately small) revised sample sizes 1. Importantly, SSR should be performed once during the trial. There is no advantage of performing SSR more than once as long as the interim analysis has sufficient data 2. Therefore, there is a balance to be made between having sufficient interim data and enough time to take necessary action in response to SSR decisions while the trial is still active.
Guidelines exist to help researchers choose an appropriate interim sample size to perform SSR. These primarily focus on the gain in precision of estimates and impact on potential inflation of the type I error rate and reliable estimation of treatment effects. For example, there are regions (sample size range) where the gain in precision around estimates of the control event rate and standard deviation diminishes 1. Several authors studied the statistical properties of different estimators of nuisance parameters for binary and continuous outcomes 2, 3, 4, 5, 6. This work shows that the type I error rate inflation converges to the desired level as the interim sample size increases. These results could be used as a guide for selecting the timing of SSR. Alternatively, one could simulate trial data under different scenarios including ones with misspecified design parameters to assess the behaviour of the SSR method performed at different timepoints and select the timing that gives desired statistical properties (e.g., see 3, 7).
Guidelines exist to help researchers choose an appropriate interim sample size to perform SSR. These primarily focus on the gain in precision of estimates and impact on potential inflation of the type I error rate and reliable estimation of treatment effects. For example, there are regions (sample size range) where the gain in precision around estimates of the control event rate and standard deviation diminishes 1. Several authors studied the statistical properties of different estimators of nuisance parameters for binary and continuous outcomes 2, 3, 4, 5, 6. This work shows that the type I error rate inflation converges to the desired level as the interim sample size increases. These results could be used as a guide for selecting the timing of SSR. Alternatively, one could simulate trial data under different scenarios including ones with misspecified design parameters to assess the behaviour of the SSR method performed at different timepoints and select the timing that gives desired statistical properties (e.g., see 3, 7).
In summary
The timing of SSR can be chosen to balance the need to obtain reliable estimates of nuisance parameters (e.g., see 1), to minimise inflation of the type I error rate (e.g., see 3, 7), and for feasibility to give researchers enough time to implement adaptation decisions while trial sites are still actively recruiting patients. Statistical simulation may also help in selecting an appropriate timing that balances these considerations.
References
1. Teare et al. Sample size requirements to estimate key design parameters from external pilot randomised controlled trials: a simulation study. Trials. 2014;15(1):264.
2. Friede et al. Blinded continuous monitoring of nuisance parameters in clinical trials. J R Stat Soc Ser C. 2012;61(4):601–18.
3. Friede et al. Sample size recalculation for binary data in internal pilot study designs. Pharm Stat. 2004;3(4):269–79.
4. Friede et al. Sample Size recalculation in internal pilot study designs: A review. Biometrical J. 2006;48(4):537–55.
5. Wittes et al. Internal pilot studies I: type I error rate of the naive t-test. Stat Med. 1999;18(24):3481–91.
6. Zucker et al. Internal pilot studies II: comparison of various procedures. Stat Med. 1999;18(24):3493–509.
7. Friede et al. Sample size recalculation in Internal pilot study designs: A review. Biometrical J. 2006;48(4):537–55.
7. Friede et al. Sample size recalculation in Internal pilot study designs: A review. Biometrical J. 2006;48(4):537–55.
Prospective case studies
In addition to the examples presented here, the literature highlights the scope of SSR in trials conducted in specific disease areas 1.
CARISA trial 2
This study was a double-blinded, three-arm, parallel-group randomised trial investigating the anti-anginal and anti-ischemic effects of 750 mg and 1000 mg of ranolazine compared to placebo in adults with symptomatic chronic angina. Patients were randomised to receive one of the three treatments using a 1:1:1 allocation ratio.
The primary outcome was the change from baseline in exercise treadmill time at the trough. For this primary outcome, the researchers assumed a standard deviation (SD) of 80 seconds and they wanted to detect a target mean difference of 30 seconds in the primary endpoint between 750 mg of ranolazine and placebo, or between 1000 mg of ranolazine and placebo. To maintain a familywise type I error rate at 5%, researchers used a two-stage, step-down procedure, based on closed testing and union intersection principles 3, 4. Pooled primary outcome data from ranolazine doses were compared to the placebo. If this result was statistically significant then further hypothesis testing of each ranolazine dose against placebo would be performed. All comparisons were performed at a 5% two-sided significance level. The study required 462 patients (154 per arm) with primary outcome data to have 90% power. This was further adjusted for a 20% dropout rate to obtain approximately 577 participants.
SSR specifications
Researchers pre-planned to re-assess the sample size estimate when 231 (50%) of the planned participants had been randomised and followed up for 12 weeks to obtain primary outcome data. The design parameter for re-estimation was the SD of the change from baseline in total exercise treadmill test duration at trough (primary endpoint). This was estimated using aggregated data without the knowledge of treatment allocation using the approach proposed by Gould et al. 5, 6 which was extended to multi-arm trials 7. Thus, data were not separated by the treatment patients received when the SD was re-estimated.
SSR decisions
At the planned interim analysis, the SD was calculated based on 231 patients and this was found to be much higher than anticipated though the actual estimate was not presented in the publication. The sample size was re-calculated based on this interim SD, and the researchers increased the initial sample size to 810 participants (adjusted for dropouts). The final statistical analysis was performed as pre-planned, similar to a fixed trial design.
Results
By using SSR, the researchers were able to react to their inaccurate assumptions about the SD of the primary outcome and increased the sample size to preserve the power of 90% (given their updated assumptions). The study results showed the effectiveness of both doses of ranolazine in improving exercise duration compared to the placebo.
References
1. Wang et al. Evaluation of the extent of adaptation to sample size in clinical trials for cardiovascular and CNS diseases. Contemp Clin Trials. 2018;67:31–6.
2. Chaitman et al. Effects of Ranolazine with Atenolol, Amlodipine, or Diltiazem on exercise tolerance and Angina frequency in patients with severe chronic Angina: A Randomized controlled trial. J Am Med Assoc. 2004;291(3):309–16.
2. Chaitman et al. Effects of Ranolazine with Atenolol, Amlodipine, or Diltiazem on exercise tolerance and Angina frequency in patients with severe chronic Angina: A Randomized controlled trial. J Am Med Assoc. 2004;291(3):309–16.
3. Bauer. Multiple testing in clinical trials. Stat Med. 1991;10(6):871–90.
4. Koch et al. Statistical considerations for multiplicity in confirmatory protocols. Drug Inf J. 1996;30(2):523–34.
5. Gould et al. Sample size re-estimation without unblinding for normally distributed outcomes with unknown variance. Commun Stat - Theory Methods. 1992;21(10):2833–53.
6. Gould. Planning and revising the sample size for a trial. Stat Med. 1995;14(9–10):1039–51.
7. Kieser et al. Blinded sample size reestimation in multiarmed clinical trials. Drug Inf J. 2000 ;34(2):455–60.
Key considerations
Only a small proportion of study interventions are effective and safe to be adopted and change practice. Thus, an adaptation to change the sample size alone can be wasteful. A decision to increase the sample size for a trial that is unlikely to show benefit or change practice can raise economic and ethical issues even though the goal to maintain desired statistical power is achieved 1. This concern can be mitigated by incorporating an option to increase the sample size only if there is a good chance of the study treatment showing beneficial effects when the trial is completed. In other words, a trial could be designed to include a futility stopping at the point of SSR 2.
There is a debate on whether the sample size should be reduced if the revised sample size indicates so. It is advisable to do so when the interim analysis sample size is relatively large to give accurate estimates and when the revised sample size is excessively small (e.g., as seen in the RATPAC trial presented in Table 2). Perhaps conservatism and wording of some regulatory guidance influenced some critics to discourage reducing the sample size (see reflections on regulatory guidance on SSR). Some may fear regretting if for some reason the decision to reduce the sample size is found to be unwise when the trial is complete (e.g., when trial results are inconclusive and this could have been avoided with a larger sample size and the associated increase in precision). However, this is very unlikely to happen if the sample size at the interim review is relatively large. Furthermore, the concept of reducing the sample size fits in with early stopping trial adaptations (e.g., for futility or efficacy) as they offer an opportunity to reduce the average trial sample size (see group sequential design). However, researchers should also consider other implications such as key secondary objectives before reducing the sample size.
The implications of SSR decisions should be carefully considered at the planning stage such as recruitment feasibility and maximum trial duration. A potential increase in the initial sample size will require additional financial and research resources such as treatment costs and potentially more recruitment centres. The SSR and decision-making process should happen before recruitment is complete – when the momentum is still there. Other considerations should include how the SSR will be operationalised and which key stakeholders (e.g., trial monitoring committees, patient representative, and funders) should be involved in that process. Finally, data feeding into the SSR should be of high quality and there should be processes and procedures for transferring the data to relevant parties without compromising the trial integrity.
References
1. McClure et al. A post hoc evaluation of a sample size re-estimation in the Secondary Prevention of Small Subcortical Strokes study. Clin Trials. 2016 Oct 1;13(5):537–44.
2. Pritchett et al. Sample size re-estimation designs in confirmatory clinical trials—current state, statistical considerations, and practical guidance. Stat Biopharm Res. 2015;7(4):309–21.
2. Pritchett et al. Sample size re-estimation designs in confirmatory clinical trials—current state, statistical considerations, and practical guidance. Stat Biopharm Res. 2015;7(4):309–21.
Practical example to illustrate the application of SSR
In addition to the RATPAC trial presented below, there are useful case studies that illustrate the application of SSR methods in different settings (see 1, 2, 3, 4, 9). Here, we illustrate the use of non-comparative blinded and unblinded SSR using a completed fixed designed trial that used a binary primary outcome.
RATPAC trial 5
The RATPAC study was a two-arm, parallel-group, randomised controlled trial assessing the clinical and cost-effectiveness of using a point-of-care cardiac marker panel compared to standard of care in patients with suspected but not proven acute myocardial infarction presenting to an acute hospital emergency department in the UK. The primary outcome was the proportion of patients successfully discharged home after ED assessment, defined as patients who had (1) either left the hospital or were awaiting transport home with a discharge decision having been made within 4 hours after initial presentation and (2) suffered no major adverse event during the following 3 months. Major adverse events were defined as death, non-fatal acute myocardial infarction, life-threatening arrhythmia, emergency revascularisation or hospitalisation for myocardial ischaemia.
When designing the trial, researchers assumed that 50% of patients in the standard of care arm would be successfully discharged from the hospital based on a previous trial in a similar patient population. A 5% absolute difference in successful hospital discharge was viewed as important to declare superiority (e.g. if the hospital discharge rate increased from 50% to 55% in the point-of-care test arm). Researchers wanted to preserve an 80% power for a 5% two-sided test. Without continuity correction and using a 1:1 allocation ratio, the study needed to recruit a total of 3130 patients (1565 per arm) without accounting for dropouts.
Stata code:
sampsi 0.5 0.55, power(0.8) alpha(0.05) r(1) nocont
Suppose this study had been planned with an SSR allowing for either an increase or decrease to the original sample size of 3130 patients. The objective would be to re-estimate the standard of care successful hospital discharge rate at an interim analysis and revise the sample size accordingly if necessary. This can be done by estimating the pooled event rate (as a proxy for the standard of care event rate) or the event rate using patients in the standard-of-care arm only. For illustration purposes, we will use both approaches to highlight various implications, but in practice, researchers have to pre-specify one approach. We will perform an interim analysis after the recruitment of 705 patients per arm (~45% of the initial sample size); a choice where we are not concerned about type I error rate inflation 6 and interim estimates are likely to be sufficiently precise 7. We assume that researchers would want to preserve an 80% minimum power, a set desired maximum power of 85%, and a set maximum sample size for feasibility and costs considerations (e.g., 3400 patients in total). Table 2 presents the SSR results. The interim pooled and standard of care event rates were 22.6% and 15.2%, respectively, against the assumed standard of care event rate of 50%. Under all scenarios, the SSR decision would be to reduce the sample size.
Table 2.
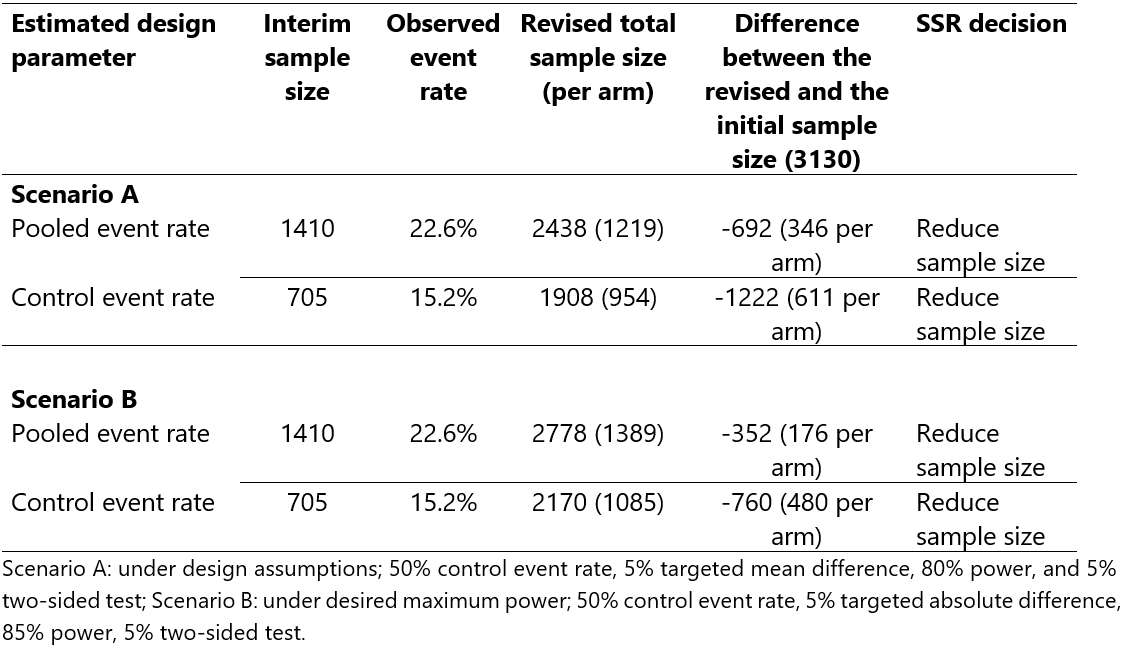
Sample size re-estimation scenarios for the RATPAC trial.
Key message
An assumed 50% successful hospital discharge rate was markedly different from both the pooled and standard of care event rates. The size of the pooled event rate was ~1.5 times more than the standard of care event rate. This was because of the overwhelming superiority of the point of care intervention compared to the standard of care. As a result, using the interim pooled event rate for SSR would have overestimated the sample size (underestimated reduction in sample size). However, it is still substantially better than not performing SSR at all, and can be easily implemented by in-house personnel. Under the assumptions considered, even to increase the power from 80% to 85%, SSR would have pointed towards revising the sample size by a huge margin, thus saving research resources and reducing the trial duration considerably. SSR can also avoid unnecessary study extension requests that would otherwise be made mainly due to poor recruitment. In fact, RATPAC researchers requested a funding extension which was turned down by funders because an independent monitoring body knew that it was not necessary as the trial had already achieved its objectives. Requesting a funding extension could have been avoided had they planned the study with SSR.
Application of a combination test method
Let us assume that researchers wanted to achieve strict control of the 5% two-sided type I error rate, had pre-specified to use an inverse normal combination test 8 with equal weights for stage 1 and stage 2 data (before and after the interim analysis), and wanted to perform blinded SSR by estimating the pooled event rate as a proxy of the standard of care event rate. SSR is performed after 705 patients (per group) have provided primary outcome data. After fitting a simple logistic regression model on data used for SSR (for 1410 patients) and on data of patients recruited after the sample size (733 given that 2143 were actually recruited for this trial) gives stage 1 and 2 test statistics of 6.50 and 8.37, respectively. With equal weights, the overall test statistic is approximately 10.5 giving a very small p-value (<0.0001) which is less than 5%. Therefore, we conclude overwhelming evidence of the effectiveness of point-of-care intervention compared to the standard of care.
Stata code:
# user-written program
Click this hyperlink to access ssrtest program code
References
1. Friede et al. Blinded sample size reestimation in event-driven clinical trials: Methods and an application in multiple sclerosis. Pharm Stat. 2019;18(3):351-365
2. Friede et al. Blinded sample size reestimation with count data: Methods and applications in multiple sclerosis. Stat Med. 2010;29(10):1145–56.
3. Wang et al. Effect of sample size re-estimation in adaptive clinical trials for Alzheimer’s disease and mild cognitive impairment. Alzheimer’s Dement Transl Res Clin Interv. 2015;1(1):63–71.
4. McClure et al. A post hoc evaluation of a sample size re-estimation in the Secondary Prevention of Small Subcortical Strokes study. Clin Trials. 2016;13(5):537–44.
5. Goodacre et al. The RATPAC (Randomised Assessment of Treatment using Panel Assay of Cardiac markers) trial: a randomised controlled trial of point-of-care cardiac markers in the emergency department. Health Technol Assess. 2011;15(23).
6. Friede et al. Sample size recalculation for binary data in internal pilot study designs. Pharm Stat. 2004;3(4):269–79.
7. Teare et al. Sample size requirements to estimate key design parameters from external pilot randomised controlled trials: a simulation study. Trials. 2014;15(1):264.
8. Lehmacher et al. Adaptive sample size calculations in group sequential trials. Biometrics. 1999;55(4):1286–90.
9. Wych et al. Sample size re-estimation in crossover trials: Application to the AIM HY-INFORM study. Trials. 2019;20(1).
9. Wych et al. Sample size re-estimation in crossover trials: Application to the AIM HY-INFORM study. Trials. 2019;20(1).
Tips for operationalising SSR
- Do not use SSR as an excuse for poor planning. There is still a need to adequately review prior evidence to inform the calculation of the initial sample size;
- Provide a rationale for SSR focusing on the existing level of uncertainty around design parameters;
- Detail how the design parameters, and subsequently the sample size, will be re-estimated (e.g., using formulae) and justify the choice of the approach used;
- Ensure the interim sample size is reasonably large to obtain reliable estimates to inform SSR. In addition, reflect on the implication of the SSR method on inflation of the type I error rate;
- Consider the implications of a sample size increase on the feasibility of recruitment and required additional research resources. Communicate and agree on the costs in case of a sample size increase with the funder;
- Agree and pre-specify decision rules for SSR, such as a cap on the maximum allowed increase;
- Conduct a mock or pilot SSR to troubleshoot any related problems during operationalisation;
- Results of the SSR should be known before completing recruitment to give researchers and key stakeholders enough time to act when sites are still actively recruiting;
- Devise processes and procedures to minimise potential operational biases that may be introduced during SSR;
- Know your key stakeholders: who will perform the SSR, who should know the results of the SSR, who is involved in data management, who are impacted by SSR decisions, who is the purse holder, etc.
Reflections on regulatory guidance on SSR
The 2019 FDA guidance 1 does not explicitly state whether the initial sample size can or cannot be revised downwards. However, it reflects that this should be based on pre-planned methods or approaches: “By using accumulating information about nuisance parameters, sample sizes can be adjusted according to prespecified algorithms to ensure the desired power is maintained” . This suggests that revising the sample size downwards or upwards can be considered as long as there is a clear rationale put forward for the adaptations and appropriate pre-planned methods are used. We assume that this reflects current regulatory thinking.
However, the superseded 2010 FDA 2 explicitly advised against reducing the sample size citing that researchers may regret incorrect decisions when SSR is based on small patients. This should not be a concern if the interim sample size is reasonably large (e.g., RATPAC trial presented in Table 2).
“Examining the data in this blinded analysis does not introduce statistical bias, and no statistical adjustments are required. […] Usually, the blinded interim analyses considered here are used to make decisions to increase the sample size, but not to decrease the study size. Decreasing sample size is not advisable because of the chance of making a poor choice caused by the high variability of the effect size and event rate or variance estimates early in the study.”
The 2013 FDA and CDER guidance 3 on good review practice states:
“The simplest situation is where the pooled (overall) event rate is used to determine the final sample size without any unbinding, an approach that does not involve statistical adjustment. Adjustment of sample size by using the event rate observed only in the control arm also can be done with no statistical adjustment, but only if the overall blinding of the trial is unequivocally maintained. However, this is a difficult task because the patients in the control group would need to be identified and this would mean some entity involved with the trial would need to be unblinded.”
“The simplest situation is where the pooled (overall) event rate is used to determine the final sample size without any unbinding, an approach that does not involve statistical adjustment. Adjustment of sample size by using the event rate observed only in the control arm also can be done with no statistical adjustment, but only if the overall blinding of the trial is unequivocally maintained. However, this is a difficult task because the patients in the control group would need to be identified and this would mean some entity involved with the trial would need to be unblinded.”
“It is also possible to assess the variance of a trial and adjust sample size upward if it is greater than expected. If the analysis is blinded for treatment assignment, there should be no need for adjustment of the alpha error.”
The 2007 CHMP 4 reflection paper on methodological issues in confirmatory clinical trials planned with an adaptive design (Section 4.2.2) states:
“Analysis methods that control the type I error must be pre-specified. Whenever possible, methods for blinded sample size reassessment that properly control the type I error should be used, especially if the sole aim of the interim analysis is the re-calculation of sample size. In cases where sample size needs to be reassessed based on unblinded data, sufficient justification should be made.”
“Analysis methods that control the type I error must be pre-specified. Whenever possible, methods for blinded sample size reassessment that properly control the type I error should be used, especially if the sole aim of the interim analysis is the re-calculation of sample size. In cases where sample size needs to be reassessed based on unblinded data, sufficient justification should be made.”
The 1998 ICH E9 5 statistical principles for clinical trials (section 4.4) reflects on the importance of SSR particularly when the trial was designed based on unreliable or uncertain information. Emphasis is put on the need to preserve blinding, considerations on implications (e.g., impact on type I error rate), pre-planning and documentation for an audit trail (e.g., in the protocol). Specifically, section 3.5 seems to focus on blinded SSR methods with an option to revise the sample size upwards. Some have interpreted this as discouraging the revision of the sample size downwards.
“When event rates are lower than anticipated or variability is larger than expected, methods for sample size re-estimation are available without unbinding data or making treatment comparisons.”
All these regulatory guidelines reflect on the appealing nature of blinded SSR methods; for example, the the 2019 FDA guidance states:
“In general, adequately prespecified adaptations based on non-comparative data have a negligible effect on the Type I error probability. This makes them an attractive choice in many settings, particularly when uncertainty about event probabilities or endpoint variability is high […] The most widely used category of adaptive design based on pooled outcome data involves sample size adaptations (sometimes called blinded sample size reestimation).”
In summary
Researchers should carefully think about and justify the SSR approach they would want to use at the design stage. In addition, when in doubt, they should discuss trial adaptations considered (e.g., revising the sample size upwards or downwards) with regulators at the planning stage where appropriate. Finally, methods used should be prespecified and appropriate depending on the SSR approach used.
References
1. FDA. Adaptive Designs for Clinical Trials of Drugs and Biologics Guidance for Industry. 2019.
2. FDA. Guidance for Industry: Adaptive Design Clinical Trials for Drugs and Biologics. 2010. Superseded.
3. FDA. Good Review Practice: Clinical Review of Investigational New Drug Applications. 2013.
4. CHMP. Reflection Paper on Methodological Issues in Confirmatory Clinical Trials Planned with an Adaptive Design. 2007.
5. ICH. ICH E9: Statistical Principles for Clinical Trials. 1998.