Adaptive Population Enrichment (APE)
Planning and design
When is an APE appropriate?
First, there should be suggestive evidence to support beliefs that a study treatment might benefit some subpopulations more than others. Biological knowledge or data from exploratory studies can be used to support the expectation of treatment effects to vary across these subpopulations. Understanding the mechanism of action of the study treatment and how it may affect the course of the disease to cause differential treatment response is important.
Second, trial participants in the heterogeneous target population need to be pre-classified (based on their baseline characteristics) into distinct subpopulations or nested subpopulations depending on the context (see 1). A number of subpopulations can be considered as long as it is possible to recruit enough patients within each subpopulation to achieve a desired power, but the multiple testing correction ‘penalty’ gets worse as the number of subpopulations increases. Scientific knowledge 2 (e.g., based on treatments’ mechanism of action), statistical methods (e.g., 3), or empirical data on subgroup response to treatment can help to identify these subpopulations. The factor(s) used to classify a heterogeneous trial population into subpopulations need to be predefined – these are referred to as enrichment factors. This classification broadly focuses on the:
- patient’s level of risk of a disease event of interest (e.g. mortality) given their baseline characteristics assuming that high-risk patients may benefit differently from low-risk patients (e.g., 4) – referred to as prognostic enrichment;
- chances of patients responding to the treatment given researchers’ understanding of the biological mechanism of action of the treatment such as based on known biomarkers 5, 6, 7 (see BigTeD on this topic), genetic markers in targeted therapies (e.g., 8), physiological or disease characteristics – referred to as predictive enrichment.
PANDA users may wish to read this relevant discussion in the context of sepsis research 9. Of note, the reliability of the classification of subpopulations (e.g., accuracy of biomarker assays or degree of uncertainty around the mechanism of action) directly influences the robustness of the APE design to address research questions.
Third, a very low prevalence of selected subpopulations may make it impractical to enrich and adequately power the trial to demonstrate the treatment benefit in these rare or limited subpopulations within a reasonable study duration. Therefore, careful considerations should be given to the feasibility of recruitment when subpopulations are intended to be enriched 10.
Third, a very low prevalence of selected subpopulations may make it impractical to enrich and adequately power the trial to demonstrate the treatment benefit in these rare or limited subpopulations within a reasonable study duration. Therefore, careful considerations should be given to the feasibility of recruitment when subpopulations are intended to be enriched 10.
Finally, like other adaptive designs, adaptation outcomes should be quickly observed relative to the pace of recruitment for the design to be of value and feasible (see general considerations).
References
1. Wang et al. Adaptive patient enrichment designs in therapeutic trials. Biometrical J. 2009;51(2):358-374.
2. Rosenblum et al. Adaptive enrichment designs for stroke clinical trials. Stroke. 2017;48(7):2021-2025.
3. Sysoev et al. PSICA: Decision trees for probabilistic subgroup identification with categorical treatments. Stat Med. 2019;38(22):4436-4452.
4. Mehta et al. Optimizing trial design: sequential, adaptive, and enrichment strategies. Circulation. 2009;119(4):597-605.
5. Antoniou et al. Biomarker-guided adaptive trial designs in phase II and phase III: A methodological review. PLoS One. 2016;11(2):e0149803.
6. Rufibach et al. Comparison of different clinical development plans for confirmatory subpopulation selection. Contemp Clin Trials. 2016;47:78-84.
7. Bhattacharyya et al. Adaptive signature design- review of the biomarker guided adaptive phase –III controlled design. Contemp Clin Trials Commun. 2019;15:100378.
8. Van Der Baan et al. Potential of adaptive clinical trial designs in pharmacogenetic research. Pharmacogenomics. 2012;13(5):571-578.
9. Stanski et al. Prognostic and predictive enrichment in sepsis. Nat Rev Nephrol. 2020;16(1):20-31.
10. Rosenblum. Practical recommendations document: Planning adaptive enrichment designs for confirmatory randomized clinical trials. 2018. Accessed February 17, 2020.
Design concepts
Figure 4 is a schematic example of an APE design with one interim analysis and options to enrich two subpopulations of interest (S1 and S2; if opportunities arise) in which the treatment effect is expected to differ considerably. Based on interim efficacy results, one of four possible adaptation decisions (A, B, C, or D) can be made. For example, if the treatment appears to benefit both subpopulations (decision A), then further recruitment will proceed as before recruiting patients from both S1 and S2 and the final analysis will evaluate the treatment effect in the full population. However, if the treatment suggested to benefit subpopulation S2 only (decision C), then further recruitment (in stage 2) will be restricted to S2 only until a desired statistical power is achieved and the final analysis will only test the treatment effect in this subpopulation S2. If the treatment is unlikely to benefit either subpopulation, then the entire trial is stopped early for futility at the end of stage 1 (decision D).
Of note, researchers choose which subpopulations should be enriched after interim analysis at the planning stage depending on the research context and what they want to achieve (e.g. based on biological knowledge and how the treatment is expected to work). For example, there are situations when researchers can justify to enrich only one subpopulation (S1 say) assuming that if the treatment benefits subpopulation S1, it should also benefit subpopulation S2 (e.g., 1, 2). This was adopted in the TAPPAS trial 3.
It is worth noting the treatment does not need to be equally effective in all subpopulations. In the previous illustrative example of multiple sclerosis, there may be a clinical rationale to expect the intervention to be less beneficial in progressive disease. Furthermore, randomisation needs to be stratified by subpopulation regardless of whether they will be enriched or not. This is to ensure a balance of patient characteristics between treatment groups within and across subpopulations.
Figure 4.
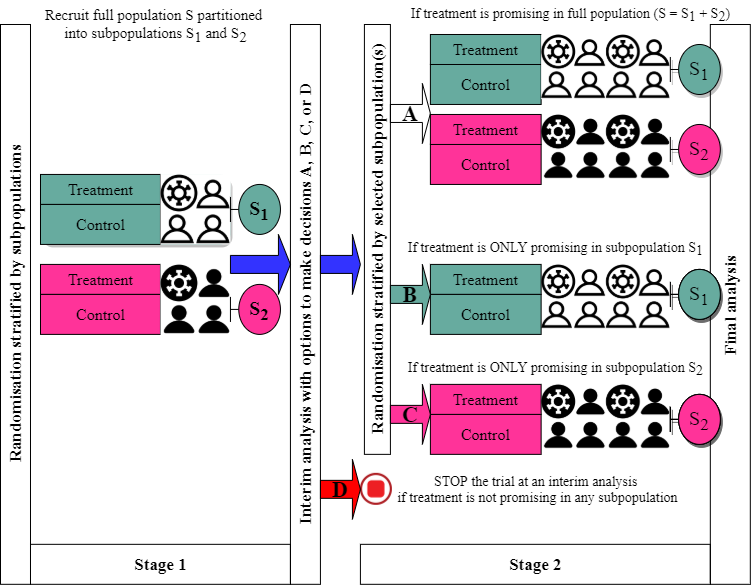
Schematic illustration of an APE with two subpopulations and one interim analysis.
At the planning stage, researchers need to consider several aspects to inform the design and the calculation of sample sizes. These include 5:
- the existing level of uncertainty around the target population and the appropriateness of an APE design;
- predefined subpopulations and how they are classed (see when is an APE appropriate?);
- supporting evidence to suggest that treatment effect may differ across subpopulations;
- subpopulation(s) they wish to enrich when the opportunity arises at interim analyses;
- targeted treatment effects in the full population and subpopulation(s) they wish to enrich;
- a set of all possible hypothesis tests to be performed at the interim and final analyses (e.g., see 4) depending on subpopulations they wish to enrich;
- prevalence of the subpopulations they wish to enrich in the target full population;
- predefined paths the trial may take depending on trial adaptations they wish to consider at interim analyses (e.g., dropping of subpopulations that are showing poor treatment response, enrichment of promising subpopulations, and stopping of the entire trial for futility);
- when to perform interim analysis (e.g., to select and enrich subpopulations) and how often;
- decision rules at interim and final analyses (e.g., criteria for claiming evidence of benefit and/or futility in the considered subpopulations and the full population) depending on adaptation considered;
- statistical method(s) for ensuring that the considered error rates are controlled at desired levels including how data from independent stages are combined (where relevant) (see underpinning statistical methods);
- outcome(s) used for interim analyses (adaptation outcome) including the correlation between adaptation and final primary outcome (if they are different);
- desired statistical power to detect average treatment effects in the full population and subpopulations they wish to enrich;
- how patients are allocated to each treatment and that the randomisation method is stratified at least by subpopulation;
- expected recruitment rates in both the full population and any subpopulations which may be enriched. This is an essential criterion in whether the APE design is feasible.
References
1. Rosenblum et al. Adaptive enrichment designs for stroke clinical trials. Stroke. 2017;48(7):2021-2025.
2. Sugitani et al. Flexible alpha allocation strategies for confirmatory adaptive enrichment clinical trials with a prespecified subgroup. Stat Med. 2018;37(24):3387-3402.
3. Mehta et al. An adaptive population enrichment phase III trial of TRC105 and pazopanib versus pazopanib alone in patients with advanced angiosarcoma (TAPPAS trial). Ann Oncol. 2019;30(1):103-108.
4. Lin et al. Sample size re-estimation in adaptive enrichment design. Contemp Clin Trials. 2021;100.
5. Maca et al. Adaptive clinical trials: Overview of phase III designs and challenges. Ther Innov Regul Sci. 2014;48(1):31-40.
How are subpopulations defined?
In APE designs, the subpopulations must be known in advance of the study starting. This is not always straightforward. In the previous multiple sclerosis example, the two disease subtypes (“relapsing-remitting” and “progressive”) are widely accepted. But what about other diseases? Consider as another example the case of type I diabetes. What constitutes subpopulations here? We could define patients as “low-risk” and “high-risk”, the latter based on whether the patient:
- had experienced a severe hypoglycaemic event in the previous year …
- … or had two severe hypoglycaemic episodes …
- … or had glycated haemoglobin (HbA1c) of greater than 7.5% (58mmol/mol), or greater than 8.5% (69mmol/mol), or …
The decision, in this case, is likely to be a pragmatic one which uses both clinical opinion and also the size of the subpopulations: the trial may be infeasible if subpopulations are too scarce. Any decision is clearly imperfect. Nevertheless, an imprecise classification may still be preferable if it is clinically meaningful than doing nothing at all and recruiting a population which is largely unresponsive to a potentially effective study treatment. See “when is an APE appropriate?” on a related discussion on approaches that can be used to define subpopulations.
Prospective case studies
Currently, APE designs are not commonly used in randomised trials as these methods are still new and developing. However, there are several examples in the literature that have illustrated its application in the context of exploratory and/or confirmatory objectives with binary, continuous, and survival primary outcomes (e.g., 1, 2, 3, 4, 5, 6, 7). Specifically, there are a few ongoing or completed trials that have used the design 8, 9, NCT04224493, NCT03805308. Of note, some APE trials (e.g. DAWN 11 and I-SPY 2 12) have been applied in the context of RAR adaptive design (i.e. with the option to change the allocation of patients to favour the treatment showing greater benefit in certain subpopulations). See detailed discussion 13 on DEFUSE 3 and DAWN trials. Here, for simplicity, we summarise a real-life case study of a randomised trial that used an APE design without multiple complex adaptations (like I-SPY 2 12,14). The PECARN study 9, 10 is another simpler APE trial that could be of interest to PANDA users where enrichment was not triggered at an interim analysis and researchers continued to enrol both subpopulations and found that the treatment effect was consistently similar across subpopulations even though the treatment was not effective.
TAPPAS trial 8, 23
TAPPAS was a two-arm, parallel-group, open-label, multi-centre, superiority, and confirmatory (Phase 3) randomised trial investigating the efficacy of TRC105 in combination with a standard dose of pazopanib (TRC105 arm) compared to single-agent pazopanib (control arm) in treating patients with angiosarcoma (AS) not amenable to curative-intent surgery who have not previously received either treatment. Patients were randomised (1:1) to receive TRC105 or control stratified by AS subpopulation (cutaneous versus non-cutaneous) and the number of lines of prior AS systemic therapy (0 versus 1/2). Cutaneous AS subpopulation was classed to include skin or scalp AS while the rest including primary subcutaneous AS were classed as a non-cutaneous subpopulation. The primary outcome was progression-free survival (PFS) of patients with unresectable AS. Progression was defined using a Response Evaluation Criteria In Solid Tumors Criteria (RECIST v1.1), as a 20% increase in the sum of the longest diameter of target lesions, or a measurable increase in a non-target lesion, or the appearance of new lesions based on independent radiology review of images. PFS was defined as the time from randomisation to either first disease progression or death from any cause (or to interim analysis when performed). More details are in accessible protocol and statistical analysis plan accessible.
1) Motivation
The decision to use adaptations was motivated by uncertainty around the expected treatment effect and potential heterogeneity in the treatment effects in the cutaneous and non-cutaneous AS subpopulations assumed to be equally represented in the full population. Researchers cited a previous study indicating greater tumour TSC105 treatment in the cutaneous subpopulation compared to non-cutaneous thereby suggesting possible differences in treatment effects in these AS subpopulations. Also, researchers were interested in enriching the cutaneous subpopulation only at an interim analysis if efficacy results were promising (as defined below) in this subpopulation. Uncertainty around the expected treatment effect was addressed through the concept of a ‘promising zone’ 15 that allows the sample size to be increased to retain a desired statistical power given the observed interim results if they fall within the interval that is viewed as of promising clinical relevance 16, 17. Researchers also included an option to increase the sample size by up to 20% to compensate for uncertainty around the expected number of PFS events, based on initial accrual assumptions and dropout rates.
2) Sample size
The expected median PFS in the pazopanib arm was 4 months. Researchers targeted an improvement in median PFS from 4 to 7.27 months as clinically relevant if TRC105 was efficacious. This corresponds to a hazard ratio (HR) of 0.55 (in the full population or enriched cutaneous subpopulation). Using Schoenfeld’s formula 18, the trial required a total of 95 events in the full population within 3 years to provide 83% power to detect a HR of 0.55 for a one-sided log-rank test at 2.5% significance level (see 8 for other assumptions on models used for patient accrual, dropout and time-to-PFS). This corresponds to a total of 190 patients recruited in 2 cohorts: 1) 120 in cohort 1 before interim analysis and 2) additional 70 in cohort 2 after an interim analysis. Depending on the interim decisions (described below), the sample size could be increased to a total of 340 patients (in full population) or enriched to recruit a total of 280 patients (120 in cohort 1 from full population and 160 in cohort 2 in the cutaneous subpopulation only). As a result, the study total sample size ranged from 190 to 340 patients. Mehta et al. 8 (in Table 1) summarise the operating characteristics of the design estimated via simulations under several assumptions using East v6.1 Software.
3) Interim analysis and adaptation decision rules
Based on interim efficacy results, researchers had planned to enrich the cutaneous AS subpopulation with an option to change the sample sizes. One interim analysis (which was expected at 25 months from randomisation) was planned when 40 PFS events were observed or at 30 days after recruiting 120 patients in cohort 1. At this point, the conditional power will be calculated as a measure of efficacy in the full population (CPF) and the cutaneous subpopulation (CPS) using the formulae detailed in the supplementary appendix (see 8). The following interim decisions were considered (see Figure 2 decision tree in 8):
- if CPF <0.3 and CPS <0.5, (the results are in the unfavourable zone), then enrol 70 patients to cohort 2 and follow them up until 35 PFS events are observed and then test the effect in the full population;
- if CPF <0.3 and CPS ≥0.5, the results are in the enrichment zone for demonstrating benefit in cutaneous subpopulation; enrol 160 patients in cutaneous subpopulation only to cohort 2 and follow them up until 110 PFS events are observed from the combined patients in both cohorts with the cutaneous disease only. At the end of the trial, evaluate treatment effect only in the cutaneous subpopulation;
- if 0.3≤ CPF ≤0.95, the results for demonstrating benefit in the full population are in the promising zone so increase cohort 2 enrolment in full population from 70 to 220 patients (i.e. PFS events increased from 35 to 110 PFS). In the end, test treatment effect in the full population;
- if CPF >0.95, the results for demonstrating benefit in the full population are in the favourable zone; enrol 70 patients to cohort 2 and follow them until 35 PFS events are observed then evaluate the effect in the full population.
The independent data monitoring committee (IDMC) were able to recommend early stopping for futility based on their clinical judgements when interim efficacy results indicated that TRC105 was performing worse than the control. However, this was not formally incorporated into the trial design when operating characteristics were calculated but it was disclosed in the protocol.
4) Statistical methods
The objective was to test treatment efficacy in the full population and cutaneous subpopulation only. To achieve this, Mehta et al. 8 describe a closed family of three possible null hypotheses that can be tested for: 1) full population; 2) cutaneous subpopulation, and; 3) rejecting both null hypotheses in the full and cutaneous subpopulations (known as intersection hypothesis). They used the closed testing principle 19 to strongly control the overall type I error using the Simes adjusted p-values 20 and combination test method with pre-defined weights to combine cohort 1 and 2 data (based on methods for time-to-event outcomes 21) as detailed in a supplementary appendix 8. The authors presented analytical derivations for the two cases with and without enrichment at an interim analysis. For the closure principle, in this context, the following conditions were required to be met when claiming evidence:
- each of the three null hypotheses in the closed family is tested at the 2.5% one-sided level;
- evidence of a treatment effect in the full population is claimed if both tests in the full population and intersection (1 and 3) are significant each at the 2.5% one-sided level;
- treatment effect in cutaneous subpopulation is claimed if both tests in the cutaneous subpopulation and intersection (2 and 3) are significant each at the 2.5% one-sided level.
The one-sided p-values used here at the interim and final analyses were obtained from a log-rank test. However, researchers planned additional sensitivity analyses using a Cox regression model adjusting for stratification factors: AS subpopulation (cutaneous versus non-cutaneous) and the number of lines of prior AS systemic therapy (0 versus 1/2).
5) Interim results and decisions made
Based on data reported in the clinical trials register and other publications 22, 23, a total of 128 (64 in each group) were recruited, of which, 62 (TRC105) and 61 (control) were included in the interim analysis. As anticipated, 50% had cutaneous AS. In the full population, the median PFS was 4.2 months (95% confidence interval [CI]: 2.8 to 8.3) and 4.3 months (95% CI: 2.9 to not estimable) in the TRC105 and control groups, respectively; this gives a HR of 0.77 (95% CI: 0.46 to 1.78; p-value=0.95). In the cutaneous subpopulation, the median PFS was 4.2 months (95% CI: 2.8 to 8.3) and 5.6 months (95% CI: 2.6 to 5.6) in the TRC105 and control groups, respectively, giving a HR of 1.07 (95% CI: 0.43 to 2.7, p-value=0.89).
Based on the crude information provided by the researchers, the conditional powers in the full population (CPF) and cutaneous subpopulation (CPs) were less than 5%, which falls into the unfavourable zone (1) stated above. However, based on median PFS, TRC105 seemed to be doing worse than the control – as a result, the IDMC recommended stopping the trial for futility. TSC105 failed to demonstrate efficacy when combined with pazopanib compared to pazopanib alone in AS patients with either cutaneous or non-cutaneous disease.
6) What researchers achieved
In a single trial, researchers were able to demonstrate the treatment was not beneficial to patients with both cutaneous and non-cutaneous AS. Given the interim results, there was no need for researchers to make use of the enrichment component, however, they had contingency plans to if it turned out that the treatment was beneficial either in full population or cutaneous AS patients only. Finally, they stopped the trial early based on interim results that showed that the study treatment was worse than control.
References
1. Fisher et al. Stochastic optimization of adaptive enrichment designs for two subpopulations. J Biopharm Stat. 2018;28(5):966-982.
2. Rosenblum et al. Adaptive enrichment designs for stroke clinical trials. Stroke. 2017;48(7):2021-2025.
3. Mehta et al. Optimizing trial design: sequential, adaptive, and enrichment strategies. Circulation. 2009;119(4):597-605.
4. Van Der Baan et al. Potential of adaptive clinical trial designs in pharmacogenetic research. Pharmacogenomics. 2012;13(5):571-578.
5. Rosenblum. Practical recommendations document: Planning adaptive enrichment designs for confirmatory randomized clinical trials. 2018. Accessed February 17, 2020.
6. Wang et al. Adaptive enrichment with subpopulation selection at interim: Methodologies, applications and design considerations. Contemp Clin Trials. 2013;36(2):673-681.
7. Wassmer et al. Designing issues in confirmatory adaptive population enrichment trials. J Biopharm Stat. 2015;25(4):651-669.
8. Mehta et al. An adaptive population enrichment phase III trial of TRC105 and pazopanib versus pazopanib alone in patients with advanced angiosarcoma (TAPPAS trial). Ann Oncol. 2019;30(1):103-108.
9. Schnadower et al. Randomised controlled trial of Lactobacillus rhamnosus (LGG) versus placebo in children presenting to the emergency department with acute gastroenteritis: The PECARN probiotic study protocol. BMJ Open. 2017;7(9).
10. Schnadower et al. Lactobacillus rhamnosus GG versus Placebo for acute gastroenteritis in children. N Engl J Med. 2018;379(21):2002-2014.
11. Nogueira et al. Thrombectomy 6 to 24 hours after stroke with a mismatch between deficit and infarct. N Engl J Med. 2017;378(1):11-21.
12. Barker et al. I-SPY 2: An adaptive breast cancer trial design in the setting of neoadjuvant chemotherapy. Clin Pharmacol Ther. 2009;86(1):97-100.
13. Lai et al. Adaptive enrichment designs for confirmatory trials. Stat Med. 2019;38(4):613-624.
14. Park et al. Adaptive randomization of neratinib in early breast cancer. N Engl J Med. 2016;375(1):11-22.
15. Edwards et al. A systematic review of the “promising zone” design. Trials. 2020;21(1):1000. doi:10.1186/s13063-020-04931-w
16. Jennison et al. Adaptive sample size modification in clinical trials: start small then ask for more? Stat Med. 2015;34(29):3793-3810.
17. Chen et al. Sample size adjustment based on promising interim results and its application in confirmatory clinical trials. Clin Trials. 2015;12(6):584-595.
18. Schoenfeld. Sample-size formula for the proportional-hazards regression model. Biometrics. 1983;39(2):499.
19. Marcus et al. On closed testing procedures with special reference to ordered analysis of variance. Biometrika. 1976;63(3):655-660.
20. Simes. An improved Bonferroni procedure for multiple tests of significance. Biometrika. 1986;73(3):751–754
21. Jenkins et al. An adaptive seamless phase II/III design for oncology trials with subpopulation selection using correlated survival endpoints. Pharm Stat. 2011;10(4):347-356.
22. Jones et al. Results of the TAPPAS trial: An adaptive enrichment phase III trial of TRC105 and pazopanib (P) versus pazopanib alone in patients with advanced angiosarcoma (AS). Ann Oncol. 2019;30:v683.
23. Jones et al. Efficacy and safety of TRC105 plus Pazopanib vs Pazopanib alone for treatment of patients with advanced angiosarcoma: A randomized clinical trial. JAMA Oncol. 2022;8(5):740–7.
Underpinning statistical methods
The first challenge is the identification or classification of the subpopulations. Although a more clinical consideration, this affects the performance of the design and so should be done with a high degree of accuracy – especially when some diagnostic test/algorithm is used. Specific statistical challenges include:
- defining reliable population selection rules at interim analyses;
- dealing with multiple hypothesis tests performed at interim and final analyses and correlation between test statistics from different subpopulations and the full population as well as correlation between stages and correlation between adaptation and final primary outcomes (if different);
- generating adequate statistical power to detect treatment effects of interest in selected subpopulations depending on their prevalence in the target full population and;
- choosing appropriate analysis methods to estimate treatment effects (see statistical methods for monitoring and analysis).
Several methods have been developed to address these issues (see 1, 2). All these methods require pre-specification of:
- the subpopulations of interest;
- a set of all possible hypothesis tests at interim and final analyses (note that some hypothesis tests will not be undertaken if subpopulations are dropped after interim analyses);
- the timing and frequency of interim analyses.
Some methods also require the selection rules for subpopulations to be prespecified and adhered to during the trial. Other methods allow for more flexibility on how subpopulations are selected and do not necessarily require selection rules to be fully prespecified in advance (e.g., those that use combination test methods 3). The latter also allows data from multiple sources to influence the selection process of subpopulations. However, this may be controversial in a confirmatory setting but more acceptable in exploratory or learning phases of trials.
Statistical methods applicable across various outcomes can be broadly classified into four categories based on their underlying principles 2, 3, 4, 5, 6:
- Bayesian methods 2, 7,
- group sequential 8, 9, 10, 21,
- combination test approaches 3, 7, 11, 12, 13, 27 and,
- others such as those based on non-parametric tests with categorical surrogate data 14.
These methods differ with regards to the flexibilities they offer. For example, some offer options to increase sample sizes after an interim analysis; some can deal with multiple treatment arms, handle multiple interim analyses, or accommodate multiple subpopulations; some offer multiple selection rules to choose from when designing the trial, and; some allow adaptation outcomes to be different from the primary outcome such as a surrogate endpoint 14, 15, 16 or a combination of both.
1) Bayesian methods
Bayesian methods update prior knowledge about the treatment effects using interim efficacy results. Predictive probabilities of selecting subpopulations or full population at interim analyses, and posterior probabilities of the selected subpopulations achieving a targeted treatment effect of interest (see 2, 7) are used to determine what happens next in the trial. The predictive probability needs to be above a certain predefined threshold to select a subpopulation or full population. To claim the efficacy of the study treatment in a selected subpopulation, the posterior probability needs to be above a certain specified threshold. The corresponding thresholds for predictive and posterior probabilities are selected in advance by researchers to meet the strategic decision rules of interest. Some authors recommended simulations to aid the selection of appropriate decision-making thresholds 17. Of note, these methods allow the implementation of response adaptive randomisation (RAR) in an APE design (e.g. used in the I-SPY 2 trial 18, 19).
2) Group sequential methods
These designs are an extension of methods described for a standard GSD by creating statistical decision/stopping boundaries (e.g. for stopping to claim futility) relating to the full population and subpopulations of interest 8, 9, 10, 20. Boundaries are chosen to control error rates of making incorrect conclusions about treatment effects. At an interim analysis, adaptation decisions are made based on comparing cumulative measures of treatment effects to corresponding decision boundaries relating to the considered subpopulations and full population. The methods have recently been extended to 3-arm trials in the context of two subpopulations 21.
3) Combination test methods
In this approach, each participant’s data contributes only to the analysis immediately after they were recruited, meaning the data across stages are statistically independent. This is in contrast to group sequential methods wherein data included in the first interim analysis will also be used in all subsequent analyses. For each hypothesis considered, corresponding test statistics (or stagewise test statistics, a measure of treatment effect) are calculated independently within each interim stage. The analysis then combines these stagewise test statistics across stages for each subpopulation and the full population using a predefined combination test function with prespecified weights (e.g. inverse normal method 22) in a closed testing procedure 3, 16, 23. To test intersection hypotheses, stagewise p-values relating to the tests linked to each intersection hypothesis are adjusted using an approach such as Simes’ method 24 before applying a combination test function to obtain an overall test statistic across stages. See illustrations on the application of the procedure (section 3 of 2; section 6.2 of 10). This ensures strong control of the type I error rate when the stagewise weights are fixed in advance regardless of the adaptation decisions. Some authors have also considered empirical weights that are data-driven according to adaptation decisions (e.g. to mirror an increase in sample sizes after interim analysis) 12. They also illustrated through a context-specific situation that empirical weights can result in small to negligible inflation of the type I error rate but yield valid tests. In general, combination test methods offer more flexibility in population selection but at the expense of a small reduction in power and challenges for the non-statistical audience in understanding the closed testing procedure 4.
Other related methods are based on conditional error function principle 25 with options to stop early for futility or efficacy and to increase the sample sizes in certain subpopulations that are showing interim results that are viewed as promising (see 26).
References
1. Burnett et al. Adaptive enrichment trials: What are the benefits? Stat Med. 2021;40(3):690-711.
2. Ondra et al. Methods for identification and confirmation of targeted subgroups in clinical trials: A systematic review. J Biopharm Stat. 2016;26(1):99-119.
3. Wassmer et al. Designing issues in confirmatory adaptive population enrichment trials. J Biopharm Stat. 2015;25(4):651-669.
4. Rufibach et al. Comparison of different clinical development plans for confirmatory subpopulation selection. Contemp Clin Trials. 2016;47:78-84.
5. Mehta et al. Population enrichment designs: Case study of a large multinational trial. J Biopharm Stat. 2011;21(4):831-845.
6. Stallard et al. Adaptive designs for confirmatory clinical trials with subgroup selection. J Biopharm Stat. 2014;24(1):168-187.
7. Brannath et al. Confirmatory adaptive designs with Bayesian decision tools for a targeted therapy in oncology. Stat Med. 2009;28(10):1445-1463.
8. Lai et al. Adaptive enrichment designs for confirmatory trials. Stat Med. 2019;38(4):613-624.
9. Rosenblum et al. Group sequential designs with prospectively planned rules for subpopulation enrichment. Stat Med. 2016;35(21):3776-3791.
10. Magnusson et al. Group sequential enrichment design incorporating subgroup selection. Stat Med. 2013;32(16):2695-2714.
11. Mehta et al. Biomarker-driven population enrichment for adaptive oncology trials with time to event endpoints. Stat Med. 2014;33(26):4515-4531.
12. Wang et al. Adaptive patient enrichment designs in therapeutic trials. Biometrical J. 2009;51(2):358-374.
13. Friede et al. Adaptive seamless clinical trials using early outcomes for treatment or subgroup selection: Methods, simulation model and their implementation in R. Biometrical J. 2020;62(5):1264-1283.
14. Brückner et al. Nonparametric adaptive enrichment designs using categorical surrogate data. Stat Med. 2018;37(29):4507-4524.
15. Jenkins et al. An adaptive seamless phase II/III design for oncology trials with subpopulation selection using correlated survival endpoints. Pharm Stat. 2011;10(4):347-356.
16. Friede et al. A conditional error function approach for subgroup selection in adaptive clinical trials. Stat Med. 2012;31(30):4309-4320.
17. Kelly et al. An adaptive group sequential design for phase II/III clinical trials that select a single treatment from several. J Biopharm Stat. 2005;15(4):641-658.
18. Park et al. Adaptive randomization of neratinib in early breast cancer. N Engl J Med. 2016;375(1):11-22.
19. Barker et al. I-SPY 2: an adaptive breast cancer trial design in the setting of neoadjuvant chemotherapy. Clin Pharmacol Ther. 2009;86(1):97-100.
20. Lai et al. Adaptive choice of patient subgroup for comparing two treatments. Contemp Clin Trials. 2014;39(2):191-200.
21. Steingrimsson et al. Optimized adaptive enrichment designs for three-arm trials: learning which subpopulations benefit from different treatments. Biostatistics. 2021;22(2):283-297
22. Lehmacher et al. Adaptive sample size calculations in group sequential trials. Biometrics. 1999;55(4):1286-1290.
23. Millen et al. A statistical framework for decision making in confirmatory multipopulation tailoring clinical trials. Drug Inf J. 2012;46(6):647-656.
24. Marcus et al. On closed testing procedures with special reference to ordered analysis of variance. Biometrika. 1976;63(3):655-660.
25. Proschan et al. Designed extension of studies based on conditional power. Biometrics. 1995;51(4):1315-1324.
26. Lin et al. Sample size re-estimation in adaptive enrichment design. Contemp Clin Trials. 2021;100 :106216.
27. Wu et al. Incorporating surrogate information for adaptive subgroup enrichment design with sample size re-estimation. 2022;00(0): 1-2
Incorporating effect heterogeneity at the design stage
APE designs are of greatest value in scenarios for interventions whose effectiveness is expected to differ among different subpopulations but not certainly known before the trial. There are situations where if a study treatment is efficacious across subpopulations, researchers might want beneficial effects to be similar across subpopulations. In such a situation, an APE can be designed assuming the same treatment effect across subpopulations and researchers can cease recruiting to some or all subpopulations at the interim analysis stage if this effect is unlikely. However, in some situations, it may be reasonable to assume different effects in different subpopulations at the design stage and calculate the sample size accordingly.
It may be easiest to illustrate this with an example. Suppose a treatment is expected to be of most benefit in a high-risk (but uncommon) subpopulation, and have a less (but still important) impact in other patients. An APE can incorporate this information into the design and sample size calculation. The approach taken will in turn depend on the comparison(s) of primary interest.
The most immediate comparisons are:
- a joint test of efficacy in the full population. If this criterion is not met the trial could reasonably be stopped for futility.
- two separate assessments of efficacy (one for high-risk, one for low-risk). Recruitment may be ceased if one of the subpopulations shows little or no effect.
The clinical rationale for differential efficacy could be used in setting up alternative decision rules however:
- efficacy is assessed on the low-risk subpopulation, and the study continues if this achieves some (perhaps modest) effect. This is in effect a “rule in” decision and is well suited to scenarios where the high-risk subpopulation is uncommon and/or is under-represented in the trial, but is expected to demonstrate greater efficacy than the low-risk subpopulation;
- efficacy is assessed on the high-risk subpopulation, and the study stops if this fails to achieve a greater effect. This is in effect a “rule out” decision since this evidence should (by theory) preclude meaningful change in the low-risk subpopulation, but works best when there is an appreciable fraction of participants in the high-risk subpopulation.
Clearly, this approach requires sound theoretical justification that the efficacy in low-risk patients will not exceed that among high-risk patients. Again, we encourage investigators to consider several different scenarios when planning their design.
How are the decision rules defined?
The research goals influence the decision or selection rules used at interim analyses. Some designs do not allow early stopping for efficacy, and the only decisions at interim analyses are to restrict further enrolment to (enrich) selected subpopulations or progress as planned without any changes. Other designs allow selection of subpopulations based on hypothesis testing at interim analyses with options for early stopping either for efficacy or futility in certain subpopulations, or to continue the trial with selected subpopulations to gather more evidence (e.g. using group sequential methods 1).
The treatment selection rules described in multi-arm multi-stage (MAMS) designs can be applied to APE designs for selecting subpopulations at interim analyses (see 2, 3, 4, 5, 6, 7, 8, 9 for more discussion of their pros and cons). For example, one may wish to select the best promising subpopulation or set treatment effect thresholds for selecting promising subpopulations that are clinically viewed as relevant by researchers. Note that for the latter, thresholds do not necessarily need to be the same across subpopulations and researchers do not prespecify how many subpopulations to be selected. Population selection rules are based on summary statistical measures that indicate the magnitude of treatment effects or level of evidence. For example, mean differences or differences in proportions between treatment groups 8; p-values; conditional power (e.g. TAPPAS trial 10); predictive and posterior probabilities for Bayesian decision rules 7; or optimised to increase probabilities of correct decision-making 11, 12. For example, a population selection rule may state that a subpopulation should be selected if the observed mean pain improvement compared to the control is at least 2.5 points (of some pain rating scale). An efficacy stopping rule (if considered) may state that a trial is stopped to claim treatment benefit in a subpopulation or full population if the observed mean pain improvement compared to the control is greater than 5 points.
These treatment effect summary measures for each subpopulation of interest and the full population (where applicable) can be estimated based on adaptation outcomes that can be different from the final primary outcome, the same as the primary outcome, or a combination of both. The measures are then compared to decision thresholds or boundaries and corresponding decisions are made if they fall within certain decision regions (e.g. see TAPPAS trial 10 in Figure 2 decision tree). Simulations under several assumptions can help explore the appropriateness or aid the selection of interim decision/selection rules 7, 10, 13. For the latter, selection thresholds can be fine-tuned to achieve desired metrics or operating characteristics of the design as set by the researchers (e.g. to achieve certain defined utility measure 14 or error rates).
Decision rules for selecting or enriching subpopulations must be prespecified and included in the trial protocol and statistical analysis plans, as was done for the TAPPAS trial 10.
References
1. Rosenblum et al. Group sequential designs with prospectively planned rules for subpopulation enrichment. Stat Med. 2016;35(21):3776-3791.
2. Wassmer et al. Designing issues in confirmatory adaptive population enrichment trials. J Biopharm Stat. 2015;25(4):651-669.
3. Kelly et al. An adaptive group sequential design for phase II/III clinical trials that select a single treatment from several. J Biopharm Stat. 2005;15(4):641-658.
4. Friede et al. A Comparison of methods for adaptive treatment selection. Biometrical J. 2008;50(5):767-781.
5. Magnusson et al. Group sequential enrichment design incorporating subgroup selection. Stat Med. 2013;32(16):2695-2714.
6. Friede et al. A conditional error function approach for subgroup selection in adaptive clinical trials. Stat Med. 2012;31(30):4309-4320.
7. Brannath et al. Confirmatory adaptive designs with Bayesian decision tools for a targeted therapy in oncology. Stat Med. 2009;28(10):1445-1463.
8. Benner et al. Timing of the interim analysis in adaptive enrichment designs. J Biopharm Stat. 2018;28(4):622-632.
9. Krisam et al. Decision rules for subgroup selection based on a predictive biomarker. J Biopharm Stat. 2014;24(1):188-202.
10. Mehta et al. An adaptive population enrichment phase III trial of TRC105 and pazopanib versus pazopanib alone in patients with advanced angiosarcoma (TAPPAS trial). Ann Oncol. 2019;30(1):103-108.
11. Götte et al. Improving probabilities of correct decision in population enrichment designs based on normalized test statistics. J Biopharm Stat. 2015;25(5):1020-1038.
12. Burnett et al. Adaptive enrichment trials: What are the benefits? Stat Med. 2021;40(3):690-711.
13. Friede et al. Adaptive seamless clinical trials using early outcomes for treatment or subgroup selection: Methods, simulation model and their implementation in R. Biometrical J. 2020;62(5):1264-1283.
14. Uozumi et al. Utility-based interim decision rule planning in adaptive population selection designs with survival endpoints. Stat Biopharm Res. 2020;12(3):360-368.
When to conduct interim analyses and how often?
There is no universal rule that applies to every research context. The need for one or more interim analyses should be assessed by balancing the added benefits of conducting additional analyses against the practicalities and further resources needed (see general considerations). For example, most APE designs are based on one interim analysis due to increased statistical complexities of implementing a design with multiple looks. It has also been shown that the timing of the interim analysis, the selection rules and their scales of the treatment effect, and other trial features (e.g., underlying prevalence) can have a major impact on the statistical power of the trial (see 1).
Researchers should consider several alternative elements of the design to assess which performs best under scenarios they believe are most likely. This could be achieved via simulations as illustrated in the literature 1, 2, 3 or using available guidance when performing simulations in adaptive trials 4. In this, the statistician simulates data under different:
- treatment effects in each subpopulation of interest,
- number and timing of interim analyses (optional where relevant),
- population selection rules.
Doing so allows researchers to explore how their choices and other features impact on the desired characteristics of the design they wish to achieve to answer research questions. PANDA users may wish to read other considerations when early stopping is an option.
References
1. Benner et al. Timing of the interim analysis in adaptive enrichment designs. J Biopharm Stat. 2018;28(4):622-632.
2. Mehta et al. Population enrichment designs: Case study of a large multinational trial. J Biopharm Stat. 2011;21(4):831-845.
3. Friede et al. Adaptive seamless clinical trials using early outcomes for treatment or subgroup selection: Methods, simulation model and their implementation in R. Biometrical J. 2020;62(5):1264-1283.
4. Mayer et al. Simulation practices for adaptive trial designs in drug and device development. Stat Biopharm Res. 2019;11(4):325–35.
Costing considerations
Like other adaptive designs, interim analyses and trial adaptations bring additional resource demands that should be carefully considered and costed in a grant application (see general considerations). These driving elements of costs include:
- potential increase in sample sizes;
- additional statistical support such as for design and simulation work, protocol development, analysis plans, interim and final analyses, and reporting;
- additional trial management requirements (e.g., to deal with potential adaptations and implications of adaptations);
- infrastructure to cope with adaptations (e.g., randomisation and database management systems);
- additional data management requirements that are driven by the need to conduct interim analysis (e.g., real-time data collection and cleaning).
Researchers may wish to read the general discussion on these issues (see general considerations).
Ethics considerations
Generally, APE designs are ethically advantageous as they help answer in a single trial whether potentially effective treatments benefit the entire target population or the treatment should be targeted at particular subpopulations. However, changes in eligibility as a result of adaptation decisions entails the need to ensure that enrolled patients are fully aware of updated trial information. Potential biases in treatment effect estimates is also an ethical issue (which applies in every trial) so researchers should ensure that methods used to estimate treatment effects produce reliable estimates to reach robust conclusions. Furthermore, how researchers deal with overrunning participants (see related discussion 1, 2), especially when certain subpopulations are dropped should be considered carefully and disclosed in the protocol (see general considerations).
References
1. Whitehead et al. Overrunning and underrunning in sequential clinical trials. Control Clin Trials. 1992;13(2):106-121.
2. Baldi et al. Overrunning in clinical trials: some thoughts from a methodological review. Trials. 2020;21(1):668.
2. Baldi et al. Overrunning in clinical trials: some thoughts from a methodological review. Trials. 2020;21(1):668.
Tips on justifying the design to stakeholders
It is important to articulate the scientific rationale and appropriateness of the design to research stakeholders such as funders, regulators, ethics committees, and patients. The main selling point of this design is the ability to address multiple research questions in a single trial on whether study treatment benefits the entire target population or can be targeted to benefit specific subpopulations. Thus avoiding the risk of a null effect finding based on analysis of the full population when specific subpopulations may benefit from a study treatment. Based on accrued efficacy results, study eligibility is changed to focus on recruiting to trial subpopulations which are likely to benefit from study treatment or the entire study could be stopped early if there is little evidence that the treatment is benefiting any subpopulation. This saves research time and resources compared to running a series of independent trials for each subpopulation if a treatment is first shown to be ineffective in the target full population.
The design also offers ethical advantages as subpopulations for which there is evidence of lack of benefit are dropped early and patients most likely to benefit are selected and treated during the remainder of the study.
The design also offers ethical advantages as subpopulations for which there is evidence of lack of benefit are dropped early and patients most likely to benefit are selected and treated during the remainder of the study.
Summary of key considerations
There are general issues that apply across adaptive designs (see general considerations). Here we reflect on key specific considerations as an APE design comes with an additional number of challenges (see 1, 2):
1) Design and feasibility aspects
Despite efficiency gains and ethical benefits, designing APE trials can be daunting and time-consuming but not discouraged, since there are several elements that influence the performance of the design that need to be thought through and specified upfront (see design concepts). The design requires assumptions to be made in advance about several parameters, which could be challenging if previous related data are unavailable or limited. Also, researchers should be committed to recruiting the maximum sample size to evaluate the treatment benefit in all selected subpopulations, assuming none is dropped at interim analyses. This can be challenging and infeasible for very low prevalent subpopulations. As such, the feasibility of recruitment should be assessed carefully at the design stage.
2) Classification of subpopulations
The efficiency of the design depends primarily on the robust partitioning of the target population into subpopulations informed by clinical knowledge combined with prior exploratory data or other methods (e.g., risk partitioning using a validated biomarker, risk model or decision tree given baseline characteristics of participants). Researchers should justify in the protocol how they created the subpopulations. The risks associated with misclassification of subpopulations (e.g., using a biomarker with poor diagnostic accuracy) cannot be overemphasized. Any rules for dividing participants into subpopulations should be clear, replicable, and ideally as close to clinical practice as possible.
3) Method of randomisation
It is important to balance potential prognostic factors between treatment arms across subpopulations at interim and final analyses, which can be achieved by using stratified block randomisation 3 or minimisation 4. This will allow researchers to generate robust inference relating to subpopulations and the full population at interim and final analyses.
4) Choice of population selection rules
The choice of appropriate decision rules (e.g., for selecting subpopulations or stopping early for efficacy) is not a straightforward task and should not be left to the statistician alone. It is important to seek the input of other research team members (e.g., clinicians, trialists) and other stakeholders where relevant (e.g., regulators, sponsors, and patient representatives). This will enhance the acceptability of results following the trial to change practice. The issues that are discussed (in GSD trials and general considerations) regarding early stopping, the timing of interim analyses, and whether there will be sufficient data to inform population selection also apply here.
5) Implications of adaptation decisions on trial governance
Adaptation decisions that drop at least one subpopulation will result in a change in eligibility of participants for the remainder of the trial. In turn, this will necessitate amendments to trial documents and related approvals from ethics committees. The details of an APE design with implications of adaptation decisions and the paths the trial could take after adaptations should be prespecified, documented in the protocol, and disclosed to key stakeholders such as regulators and ethics committees before the trial begins (e.g. ,via scientific advice meetings). This will also mitigate potential delays that can occur when researchers seek approval to amend trial documents as a consequence of adaptation decisions made.
6) Implications of adaptation decisions on information systems
The changes to trial eligibility will affect case report forms (CRFs) such as those relating to eligibility, elements of the database, and how sites recruit eligible patients after enrichment adaptation decisions. For instance, features of the electronic CRFs may need to be revoked such that sites do not accidentally recruit participants who belong to dropped subpopulations. Similarly, implications on the randomisation system should be carefully considered at the planning stage. For instance, stopping recruitment in certain subpopulations that were used to stratify or minimise randomisation implies further randomisation in those strata will cease or be disabled. This will require the training of the research team and sites before the trial and effective communication of the implications of adaptation decisions with the site staff. Also, patient information sheets will need updating after an interim analysis when patient eligibility is modified (e.g., after dropping certain subpopulations).
7) Estimation of treatment effects
The estimation of point and interval estimates is not straightforward as bias, mainly because of treatment selection, can be substantial. There is no single best adjustment approach that suits every situation. Researchers should therefore explore appropriate methods that are suited to their research context. It should be noted that this is an area of ongoing research.
Some considerations are discussed in the literature 1, 2, 5. Finally, some considerations that apply across adaptive designs have been discussed (see general considerations). Some authors have formally explored the influence of accrual rates, time to outcome assessment, and prognostic factors on operating characteristics of the designs via simulation using an example 6.
References
1. Rosenblum et al. Adaptive enrichment designs for stroke clinical trials. Stroke. 2017;48(7):2021-2025.
2. Rosenblum. Practical recommendations document: Planning adaptive enrichment designs for confirmatory randomized clinical trials. 2018. Accessed February 17, 2020.
3. Suresh. An overview of randomization techniques: An unbiased assessment of outcome in clinical research. J Hum Reprod Sci. 2011;4(1):8-11.
4. Altman et al. Treatment allocation by minimisation. BMJ. 2005;330(7495):843.
5. Wang et al. Adaptive enrichment with subpopulation selection at interim: Methodologies, applications and design considerations. Contemp Clin Trials. 2013;36(2):673-681.
6. Qian et al. Sensitivity of adaptive enrichment trial designs to accrual rates, time to outcome measurement, and prognostic variables. Contemp Clin Trials Commun. 2017;8:39-48.